Your Dashboard answers one question: “What do I need to do right now?” Open the app, glance at the numbers, and know exactly where to focus your energy today.
> Business Impact: Managers with pipeline visibility close 25% more deals because they catch stuck leads early. Without a dashboard, you discover a lead went cold after it’s too late. With one, you see it before it happens.
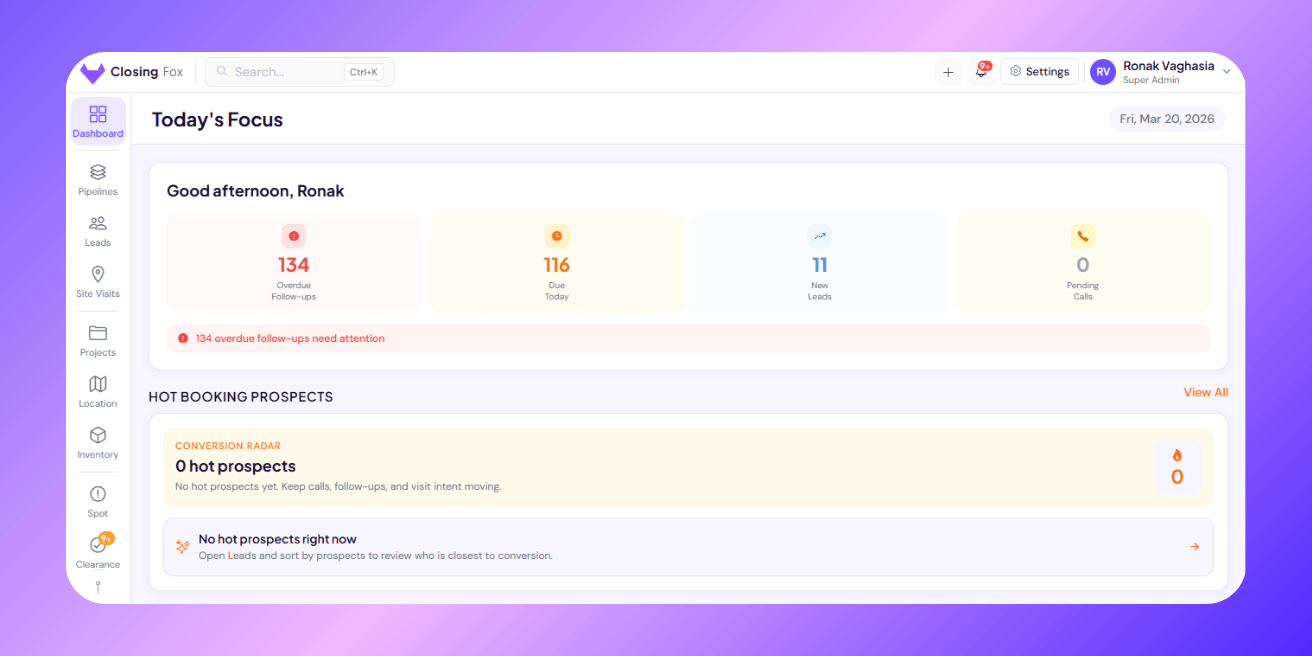
The Hero Card — your morning briefing
The top card shows 4 numbers. Here’s what each means and what to do about it:
| Number | What it means | What to do |
|---|---|---|
| Overdue Follow-ups | Leads where the follow-up date has passed. You were supposed to call but didn’t. | Call them now. These are your most at-risk leads. Every day overdue = lower chance of conversion. |
| Due Today | Follow-ups scheduled for today. These people are expecting your call. | Work through these before taking new leads. They already know you — warm conversations convert better. |
| New Leads | Leads that arrived today from portals, ads, or manual entry. | Call within 5 minutes if possible. Speed-to-lead is the #1 conversion driver. |
| Pending Calls | Calls detected on your phone that haven’t been logged yet. | Open Call Logs, confirm or dismiss. Keeps your records clean. |
Tap any number to jump straight to those leads.
> The smart nudge (colored bar below the numbers) tells you the single most important thing right now. Red = overdue follow-ups. Orange = pending calls. Blue = leads waiting for assignment. Green = you’re all caught up.
Hot Booking Prospects — your closest deals
ClosingFox scores every lead based on multiple signals:
- How many calls connected?
- Any site visits done?
- Follow-ups being kept?
- How far along the pipeline?
- How recent was the last activity?
Leads that score high on all of these are marked Hot. These are closest to booking.
What to do: Focus your energy here. These leads are ready — one more call or one more visit could close the deal.
> Business Impact: Without prospect scoring, your team treats all leads equally. With it, they know which 5 leads out of 200 are most likely to book this week. That focus alone can increase conversion by 15-20%.
Follow-up Status — overdue, today, upcoming
Three tiles show the health of your follow-up discipline:
| Tile | Meaning | Ideal number |
|---|---|---|
| Overdue | Follow-ups you missed | 0. Any number above 0 means leads are being neglected. |
| Due Today | Scheduled for today | Depends on team size. A busy closer might have 10-15/day. |
| Upcoming | Scheduled for future dates | Higher is better — means your team is planning ahead. |
If someone has 0 Overdue and 0 Due Today, either they’re perfectly caught up — or they’re not setting follow-ups at all. Check their lead count.
> The “Longest overdue” warning shows your worst case. “Longest overdue: Rahul Sharma — 12 days.” That lead is almost certainly lost. Use this to coach your team.
Needs Attention — clearance, assignment, calls
Three cards show items waiting for action:
- Clearance — leads pending manager approval (e.g., “Not Interested” needs sign-off)
- Assignment — leads in the pending queue with no owner
- Call Logs — pending calls that need confirmation
These only show if you have permission to manage them. A salesperson won’t see Clearance or Assignment — only their manager will.
Today’s Snapshot — the daily scoreboard
Two cards side by side:
TODAY card:
- Active Leads — total leads in your selected pipeline (not in Won/Lost)
- Fresh SVs — first-time site visits done today
- Re-Visits — repeat visits done today
- Calls Made — total calls logged today
UPCOMING card:
- Fresh SVs — site visits scheduled for future dates
- Re-Visits — repeat visits scheduled
> For managers: If “Calls Made” is low by 2 PM, your team isn’t calling enough. If “Fresh SVs” is 0, no new prospects are visiting. These are leading indicators — catch them early.
Pipeline Overview — where leads are stuck
The bar chart at the bottom shows how many leads are in each stage of your selected pipeline.
What to look for:
- Fat early stages, thin later stages — leads aren’t progressing. Your team may need more calls, better qualifying, or site visit push.
- One stage overflowing — that’s your bottleneck. Example: 40 leads in “WFP” but only 3 in “Booking Ready” = site visits aren’t converting.
- “Stale Leads” count — leads stuck in the same stage for 7+ days. These need intervention.
Tap any stage bar to jump to those leads in the Kanban board.
> Business Impact: Without pipeline visibility, you don’t know you have a problem until end-of-month reviews. With the stage chart, you see it today — and fix it today.
Recent Activity — what happened in the last 24 hours
On desktop, the Dashboard shows a feed of recent events:
- Calls made (connected and missed)
- Leads moved between stages
- New leads assigned
This gives managers a real-time pulse of team activity without asking “what did you do today?”
What good numbers look like
| Metric | Healthy | Warning | Problem |
|---|---|---|---|
| Overdue Follow-ups | 0 | 1-5 | 5+ |
| Connection Ratio | 60%+ | 30-60% | Below 30% |
| Calls/Day per rep | 30+ | 15-30 | Below 15 |
| Stale Leads (7+ days) | Below 10% | 10-25% | 25%+ |
| Pending Queue | 0 | 1-10 | 10+ |
| Hot Prospects | 5+ | 1-5 | 0 |
Common questions
Why does my Dashboard show different numbers than my teammate’s?
Each person sees data based on their role. A salesperson sees only their leads. A manager sees their entire team. An owner sees everyone. The numbers are accurate — they’re just scoped to your visibility.
Can I see a specific pipeline’s data?
Yes. The Pipeline Overview section has a dropdown to switch between pipelines. Stats update instantly.
What does “Stale” mean?
A lead that’s been in the same pipeline stage for 7+ days without moving. This usually means nobody is working on it or there’s a blocker. Tap the stale count to see which leads need attention.
How often does the Dashboard refresh?
Every time you open the app or pull-to-refresh. Data is always real-time — there’s no delay.
Next Steps
- Set up your pipeline — the Dashboard reads from your pipeline stages
- Learn the 3-tap disposal — follow-up stats come from disposal data
- Enable call detection — call stats only show when calls are tracked
—
Need help reading your Dashboard? WhatsApp us or email mail@closingfox.com. We’ll walk you through your numbers.